分析 Caddy
程序分析是程序在运行时资源使用的快照。分析对于识别问题区域、排查错误和崩溃以及优化代码非常有帮助。
Caddy 使用 Go 的工具来捕获分析,这被称为 pprof,它内置在 go 命令中。
分析报告 CPU 和内存的使用者,显示 goroutine 的堆栈跟踪,并帮助追踪死锁或高竞争同步原语。
在报告 Caddy 中的某些错误时,我们可能会要求提供分析。本文可以提供帮助。它描述了如何使用 Caddy 获取分析,以及如何一般地使用和解释生成的 pprof 分析。
在开始之前需要了解两件事:
- **Caddy 分析不是安全敏感的。**它们包含良性的技术读数,而不是内存内容。它们不授予系统访问权限。它们可以安全地共享。
- **分析是轻量级的,可以在生产环境中收集。**事实上,这是许多用户推荐的最佳实践;请参阅本文后面的内容。
获取分析
分析可通过管理界面的 /debug/pprof/ 获取。在运行 Caddy 的机器上,在浏览器中打开它:
http://localhost:2019/debug/pprof/
您会注意到一个简单的计数和链接表格,例如:
| 计数 | 分析 |
|---|---|
| 79 | allocs |
| 0 | block |
| 0 | cmdline |
| 22 | goroutine |
| 79 | heap |
| 0 | mutex |
| 0 | profile |
| 29 | threadcreate |
| 0 | trace |
| full goroutine stack dump |
计数是快速识别泄漏的便捷方式。如果您怀疑有泄漏,请反复刷新页面,您会看到一个或多个计数不断增加。如果堆计数增长,可能是内存泄漏;如果 goroutine 计数增长,可能是 goroutine 泄漏。
点击分析并查看它们的样子。有些可能是空的,这在很多时候是正常的。最常用的是 goroutine(函数堆栈)、heap(内存)和 profile(CPU)。其他分析对于排查互斥锁竞争或死锁很有用。
在底部,有每个分析的简单描述:
- allocs: 过去所有内存分配的采样
- block: 导致在同步原语上阻塞的堆栈跟踪
- cmdline: 当前程序的命令行调用
- goroutine: 所有当前 goroutine 的堆栈跟踪。使用 debug=2 作为查询参数以与未恢复的 panic 相同的格式导出。
- heap: 活动对象的内存分配采样。您可以指定 gc GET 参数在获取堆样本之前运行 GC。
- mutex: 持有竞争互斥锁的堆栈跟踪
- profile: CPU 分析。您可以在 seconds GET 参数中指定持续时间。获取分析文件后,使用 go tool pprof 命令调查分析。
- threadcreate: 导致创建新操作系统线程的堆栈跟踪
- trace: 当前程序执行的跟踪。您可以在 seconds GET 参数中指定持续时间。获取跟踪文件后,使用 go tool trace 命令调查跟踪。
下载分析
点击上面 pprof 索引页面上的链接将为您提供文本格式的分析。这对于调试很有用,这也是我们 Caddy 团队的首选,因为我们可以扫描它以寻找明显的线索,而无需额外的工具。
但二进制实际上是默认格式。HTML 链接附加 ?debug= 查询字符串参数以将它们格式化为文本,除了(CPU)"profile" 链接,它没有文本表示。
这些是您可以设置的查询字符串参数(来自 Go 文档):
debug=N(除 cpu 外的所有分析): 响应格式:N = 0:二进制(默认),N > 0:纯文本gc=N(堆分析): N > 0:在分析之前运行垃圾回收周期seconds=N(allocs、block、goroutine、heap、mutex、threadcreate 分析): 返回增量分析seconds=N(cpu、trace 分析): 在给定持续时间内分析
因为这些是 HTTP 端点,您也可以使用任何 HTTP 客户端(如 curl 或 wget)下载分析。
下载分析后,您可以将它们上传到 GitHub issue 评论或使用 pprof.me 等网站。对于 CPU 分析,flamegraph.com 是另一个选项。
远程访问
如果您已经能够在本地访问管理 API,请跳过本节。
默认情况下,Caddy 的管理 API 只能通过回环套接字访问。但是,至少有 3 种方法可以远程访问 Caddy 的 /debug/pprof 端点:
通过您的站点反向代理
一个简单的选项是从您的站点反向代理到它:
reverse_proxy /debug/pprof/* localhost:2019 {
	header_up Host {upstream_hostport}
}
当然,这将使分析对可以连接到您站点的人可用。如果不需要这样,您可以使用您选择的 HTTP 认证模块添加一些认证。
(不要忘记 /debug/pprof/* 匹配器,否则您将代理整个管理 API!)
SSH 隧道
另一种方法是使用 SSH 隧道。这是您计算机和服务器之间使用 SSH 协议的加密连接。在您的计算机上运行如下命令:
ssh -N username@example.com -L 8123:localhost:2019这将 localhost:8123(在您的本地机器上)隧道到 example.com 上的 localhost:2019。确保根据需要替换 username、example.com 和端口。
然后在另一个终端中,您可以像这样运行 curl:
curl -v http://localhost:8123/debug/pprof/ -H "Host: localhost:2019"您可以通过在隧道的两端使用端口 2019 来避免 -H "Host: ..." 的需要(但这要求您自己的计算机上的端口 2019 尚未被占用,即本地没有运行 Caddy)。
当隧道处于活动状态时,您可以访问任何和所有管理 API。在 ssh 命令上按 Ctrl+C 关闭隧道。
长期运行的隧道
使用上述命令运行隧道需要您保持终端打开。如果您想在后台运行隧道,可以像这样启动隧道:
ssh -f -N -M -S /tmp/caddy-tunnel.sock username@example.com -L 8123:localhost:2019这将在后台启动并在 /tmp/caddy-tunnel.sock 创建控制套接字。然后,您可以在完成后使用控制套接字关闭隧道:
ssh -S /tmp/caddy-tunnel.sock -O exit e远程管理 API
您还可以配置管理 API 以接受来自授权客户端的远程连接。
(待办:撰写有关此内容的文章。)
Goroutine 分析
goroutine 转储对于了解存在哪些 goroutine 以及它们的调用堆栈是什么很有用。换句话说,它让我们了解当前正在执行或阻塞/等待的代码。
如果您点击 "goroutines" 或转到 /debug/pprof/goroutine?debug=1,您将看到 goroutine 列表及其调用堆栈。例如:
goroutine profile: total 88
23 @ 0x43e50e 0x436d37 0x46bda5 0x4e1327 0x4e261a 0x4e2608 0x545a65 0x5590c5 0x6b2e9b 0x50ddb8 0x6b307e 0x6b0650 0x6b6918 0x6b6921 0x4b8570 0xb11a05 0xb119d4 0xb12145 0xb1d087 0x4719c1
#	0x46bda4	internal/poll.runtime_pollWait+0x84			runtime/netpoll.go:343
#	0x4e1326	internal/poll.(*pollDesc).wait+0x26			internal/poll/fd_poll_runtime.go:84
#	0x4e2619	internal/poll.(*pollDesc).waitRead+0x279		internal/poll/fd_poll_runtime.go:89
#	0x4e2607	internal/poll.(*FD).Read+0x267				internal/poll/fd_unix.go:164
#	0x545a64	net.(*netFD).Read+0x24					net/fd_posix.go:55
#	0x5590c4	net.(*conn).Read+0x44					net/net.go:179
#	0x6b2e9a	crypto/tls.(*atLeastReader).Read+0x3a			crypto/tls/conn.go:805
#	0x50ddb7	bytes.(*Buffer).ReadFrom+0x97				bytes/buffer.go:211
#	0x6b307d	crypto/tls.(*Conn).readFromUntil+0xdd			crypto/tls/conn.go:827
#	0x6b064f	crypto/tls.(*Conn).readRecordOrCCS+0x24f		crypto/tls/conn.go:625
#	0x6b6917	crypto/tls.(*Conn).readRecord+0x157			crypto/tls/conn.go:587
#	0x6b6920	crypto/tls.(*Conn).Read+0x160				crypto/tls/conn.go:1369
#	0x4b856f	io.ReadAtLeast+0x8f					io/io.go:335
#	0xb11a04	io.ReadFull+0x64					io/io.go:354
#	0xb119d3	golang.org/x/net/http2.readFrameHeader+0x33		golang.org/x/net@v0.14.0/http2/frame.go:237
#	0xb12144	golang.org/x/net/http2.(*Framer).ReadFrame+0x84		golang.org/x/net@v0.14.0/http2/frame.go:498
#	0xb1d086	golang.org/x/net/http2.(*serverConn).readFrames+0x86	golang.org/x/net@v0.14.0/http2/server.go:818

1 @ 0x43e50e 0x44e286 0xafeeb3 0xb0af86 0x5c29fc 0x5c3225 0xb0365b 0xb03650 0x15cb6af 0x43e09b 0x4719c1
#	0xafeeb2	github.com/caddyserver/caddy/v2/cmd.cmdRun+0xcd2					github.com/caddyserver/caddy/v2@v2.7.4/cmd/commandfuncs.go:277
#	0xb0af85	github.com/caddyserver/caddy/v2/cmd.init.1.func2.WrapCommandFuncForCobra.func1+0x25	github.com/caddyserver/caddy/v2@v2.7.4/cmd/cobra.go:126
#	0x5c29fb	github.com/spf13/cobra.(*Command).execute+0x87b						github.com/spf13/cobra@v1.7.0/command.go:940
#	0x5c3224	github.com/spf13/cobra.(*Command).ExecuteC+0x3a4					github.com/spf13/cobra@v1.7.0/command.go:1068
#	0xb0365a	github.com/spf13/cobra.(*Command).Execute+0x5a						github.com/spf13/cobra@v1.7.0/command.go:992
#	0xb0364f	github.com/caddyserver/caddy/v2/cmd.Main+0x4f						github.com/caddyserver/caddy/v2@v2.7.4/cmd/main.go:65
#	0x15cb6ae	main.main+0xe										caddy/main.go:11
#	0x43e09a	runtime.main+0x2ba									runtime/proc.go:267

1 @ 0x43e50e 0x44e9c5 0x8ec085 0x4719c1
#	0x8ec084	github.com/caddyserver/certmagic.(*Cache).maintainAssets+0x304	github.com/caddyserver/certmagic@v0.19.2/maintain.go:67

...
第一行 goroutine profile: total 88 告诉我们我们在看什么以及有多少个 goroutine。
goroutine 列表如下。它们按调用堆栈分组,按频率降序排列。
goroutine 行具有以下语法:<count> @ <addresses...>
该行以具有相关调用堆栈的 goroutine 数量开始。@ 符号表示调用指令地址的开始,即发起 goroutine 的函数指针。每个指针都是一个函数调用或调用帧。
您可能会注意到,您的许多 goroutine 共享相同的第一个调用地址。这是您程序的主入口点。一些 goroutine 不会从那里开始,因为程序有各种 init() 函数,Go 运行时也可能生成 goroutine。
后面的行以 # 开头,实际上只是为了读者的利益而添加的注释。它们包含 goroutine 的当前堆栈跟踪。顶部代表堆栈的顶部,即当前正在执行的代码行。底部代表堆栈的底部,或 goroutine 最初开始运行的代码。
堆栈跟踪具有以下格式:
<address> <package/func>+<offset> <filename>:<line>
地址是函数指针,然后您会看到 Go 包和函数名(如果是方法,则包含关联的类型名),以及函数内的指令偏移量。然后在最后可能是最有用的信息,文件名和行号。
完整 goroutine 堆栈转储
如果我们将查询字符串参数更改为 ?debug=2,我们将获得完整转储。这包括每个 goroutine 的详细堆栈跟踪,并且相同的 goroutine 不会折叠。在繁忙的服务器上,此输出可能非常大,但这是有趣的信息!
让我们看一个对应于上面第一个调用堆栈的(截断的):
goroutine 61961905 [IO wait, 1 minutes]:
internal/poll.runtime_pollWait(0x7f9a9a059eb0, 0x72)
	runtime/netpoll.go:343 +0x85
...
golang.org/x/net/http2.(*serverConn).readFrames(0xc001756f00)
	golang.org/x/net@v0.14.0/http2/server.go:818 +0x87
created by golang.org/x/net/http2.(*serverConn).serve in goroutine 61961902
	golang.org/x/net@v0.14.0/http2/server.go:930 +0x56a
尽管它很冗长,但这个转储唯一提供的最有用的信息是每个 goroutine 的第一行和最后一行。
第一行包含 goroutine 的编号(61961905)、状态("IO wait")和持续时间("1 minutes"):
-
Goroutine 编号: 是的,goroutine 有编号!但它们不会暴露给我们的代码。然而,这些编号在堆栈跟踪中特别有帮助,因为我们可以看到哪个 goroutine 生成了这个(见最后:"created by ... in goroutine 61961902")。下面显示的工具帮助我们绘制这个的可视化图表。
-
状态: 这告诉我们 goroutine 当前正在做什么。以下是一些您可能看到的状态:
running:执行代码 - 太棒了!IO wait:等待网络。不消耗操作系统线程,因为它停放在非阻塞网络轮询器上。sleep:我们都需要更多。select:在 select 上阻塞;等待 case 变为可用。select (no cases):特别在空的 selectselect {}上阻塞。Caddy 在其主函数中使用一个来保持运行,因为关闭是从其他 goroutine 发起的。chan receive:在通道接收(<-ch)上阻塞。semacquire:等待获取信号量(低级同步原语)。syscall:执行系统调用。消耗操作系统线程。
-
持续时间: goroutine 存在了多长时间。对于查找 goroutine 泄漏等错误很有用。例如,如果我们期望所有网络连接在几分钟后关闭,当我们发现大量 netconn goroutine 存活数小时时,这意味着什么?
解释 goroutine 转储
Without looking at code, what can we learn about the above goroutine?
It was created only about a minute ago, is waiting for data over a network socket, and its goroutine number is quite large (61961905).
From the first dump (debug=1), we know its call stack is executed relatively frequently, and the large goroutine number combined with the short duration suggests that there have been tens of millions of these relatively short-lived goroutines. It's in a function called pollWait and its call history includes reading HTTP/2 frames from an encrypted network connection that uses TLS.
So, we can deduce that this goroutine is serving an HTTP/2 request! It's waiting on data from the client. What's more, we know that the goroutine that spawned it is not one of the first goroutines of the process because it also has a high number; finding that goroutine in the dump reveals that it was spawned to handle a new HTTP/2 stream during an existing request. By contrast, other goroutines with high numbers may be spawned by a low-numbered goroutine (such as 32), indicating a brand new connection fresh off an Accept() call from the socket.
Every program is different, but when debugging Caddy, these patterns tend to hold true.
Memory profiles
Memory (or heap) profiles track heap allocations, which are the major consumers of memory on a system. Allocations are also a usual suspect for performance problems because allocating memory requires system calls, which can be slow.
Heap profiles look similar to goroutine profiles in nearly every way except the start of the top line. Here's an example:
0: 0 [1: 4096] @ 0xb1fc05 0xb1fc4d 0x48d8d1 0xb1fce6 0xb184c7 0xb1bc8e 0xb41653 0xb4105c 0xb4151d 0xb23b14 0x4719c1
#	0xb1fc04	bufio.NewWriterSize+0x24					bufio/bufio.go:599
#	0xb1fc4c	golang.org/x/net/http2.glob..func8+0x6c				golang.org/x/net@v0.17.0/http2/http2.go:263
#	0x48d8d0	sync.(*Pool).Get+0xb0						sync/pool.go:151
#	0xb1fce5	golang.org/x/net/http2.(*bufferedWriter).Write+0x45		golang.org/x/net@v0.17.0/http2/http2.go:276
#	0xb184c6	golang.org/x/net/http2.(*Framer).endWrite+0xc6			golang.org/x/net@v0.17.0/http2/frame.go:371
#	0xb1bc8d	golang.org/x/net/http2.(*Framer).WriteHeaders+0x48d		golang.org/x/net@v0.17.0/http2/frame.go:1131
#	0xb41652	golang.org/x/net/http2.(*writeResHeaders).writeHeaderBlock+0xd2	golang.org/x/net@v0.17.0/http2/write.go:239
#	0xb4105b	golang.org/x/net/http2.splitHeaderBlock+0xbb			golang.org/x/net@v0.17.0/http2/write.go:169
#	0xb4151c	golang.org/x/net/http2.(*writeResHeaders).writeFrame+0x1dc	golang.org/x/net@v0.17.0/http2/write.go:234
#	0xb23b13	golang.org/x/net/http2.(*serverConn).writeFrameAsync+0x73	golang.org/x/net@v0.17.0/http2/server.go:851
The first line format is as follows:
<live objects> <live memory> [<allocations>: <allocation memory>] @ <addresses...>
In the example above, we have a single allocation made by bufio.NewWriterSize() but currently no live objects from this call stack.
Interestingly, we can infer from that call stack that the http2 package used a pooled 4 KB to write HTTP/2 frame(s) to the client. You'll often see pooled objects in Go memory profiles if hot paths have been optimized to reuse allocations. This reduces new allocations, and the heap profile can help you know if the pool is being used properly!
CPU profiles
CPU profiles help you understand where the Go program is spending most of its scheduled time on the processor.
However, there is no plaintext form for these, so in the next section, we'll use go tool pprof commands to help us read them.
To download a CPU profile, make a request to /debug/pprof/profile?seconds=N, where N is the number of seconds over which you want to collect the profile. During CPU profile collection, program performance may be mildly impacted. (Other profiles have virtually no performance impact.)
When completed, it should download a binary file, aptly named profile. Then we need to examine it.
go tool pprof
We'll use Go's built-in profile analyzer to read the CPU profile as an example, but you can use it with any kind of profile.
Run this command (replacing "profile" with the actual filepath if different), which opens an interactive prompt:
go tool pprof profile
File: caddy_master
Type: cpu
Time: Aug 29, 2022 at 8:47pm (MDT)
Duration: 30.02s, Total samples = 70.11s (233.55%)
Entering interactive mode (type "help" for commands, "o" for options)
(pprof) This is something you can explore. Entering help gives you a list of commands and o will show you current options. And if you type help <command> you can get information about a specific command.
There's a lot of commands, but some common ones are:
top: Show what used the most CPU. You can append a number liketop 20to see more, or a regex to "focus" on or ignore certain items.web: Open the call graph in your web browser. This is a great way to visually see CPU usage.svg: Generate an SVG image of the call graph. It's the same aswebexcept it doesn't open your web browser and the SVG is saved locally.tree: A tabular view of the call stack.
Let's start with top. We see output like:
(pprof) top
Showing nodes accounting for 38.36s, 54.71% of 70.11s total
Dropped 785 nodes (cum <= 0.35s)
Showing top 10 nodes out of 196
      flat  flat%   sum%        cum   cum%
    10.97s 15.65% 15.65%     10.97s 15.65%  runtime/internal/syscall.Syscall6
     6.59s  9.40% 25.05%     36.65s 52.27%  runtime.gcDrain
     5.03s  7.17% 32.22%      5.34s  7.62%  runtime.(*lfstack).pop (inline)
     3.69s  5.26% 37.48%     11.02s 15.72%  runtime.scanobject
     2.42s  3.45% 40.94%      2.42s  3.45%  runtime.(*lfstack).push
     2.26s  3.22% 44.16%      2.30s  3.28%  runtime.pageIndexOf (inline)
     2.11s  3.01% 47.17%      2.56s  3.65%  runtime.findObject
     2.03s  2.90% 50.06%      2.03s  2.90%  runtime.markBits.isMarked (inline)
     1.69s  2.41% 52.47%      1.69s  2.41%  runtime.memclrNoHeapPointers
     1.57s  2.24% 54.71%      1.57s  2.24%  runtime.epollwait
The top 10 consumers of the CPU were all in the Go runtime -- in particular, lots of garbage collection (remember that syscalls are used to free and allocate memory). This is a hint that we could reduce allocations to improve performance, and a heap profile would be worthwhile.
OK, but what if we want to see CPU utilization from our own code? We can ignore patterns containing "runtime" like so:
(pprof) top -runtime
Active filters:
   ignore=runtime
Showing nodes accounting for 0.92s, 1.31% of 70.11s total
Dropped 160 nodes (cum <= 0.35s)
Showing top 10 nodes out of 243
      flat  flat%   sum%        cum   cum%
     0.17s  0.24%  0.24%      0.28s   0.4%  sync.(*Pool).getSlow
     0.11s  0.16%   0.4%      0.11s  0.16%  github.com/prometheus/client_golang/prometheus.(*histogram).observe (inline)
     0.10s  0.14%  0.54%      0.23s  0.33%  github.com/prometheus/client_golang/prometheus.(*MetricVec).hashLabels
     0.10s  0.14%  0.68%      0.12s  0.17%  net/textproto.CanonicalMIMEHeaderKey
     0.10s  0.14%  0.83%      0.10s  0.14%  sync.(*poolChain).popTail
     0.08s  0.11%  0.94%      0.26s  0.37%  github.com/prometheus/client_golang/prometheus.(*histogram).Observe
     0.07s   0.1%  1.04%      0.07s   0.1%  internal/poll.(*fdMutex).rwlock
     0.07s   0.1%  1.14%      0.10s  0.14%  path/filepath.Clean
     0.06s 0.086%  1.23%      0.06s 0.086%  context.value
     0.06s 0.086%  1.31%      0.06s 0.086%  go.uber.org/zap/buffer.(*Buffer).AppendByte
Well, it's clear that Prometheus metrics are another top consumer, but you'll notice that cumulatively, they amount to orders of magnitude less than GC above. The stark difference suggests that we should focus on reducing GC.
Let's use q to quit this profile and use the same command on the heap profile:
(pprof) top
Showing nodes accounting for 22259.07kB, 81.30% of 27380.04kB total
Showing top 10 nodes out of 102
      flat  flat%   sum%        cum   cum%
   12300kB 44.92% 44.92%    12300kB 44.92%  runtime.allocm
 2570.01kB  9.39% 54.31%  2570.01kB  9.39%  bufio.NewReaderSize
 2048.81kB  7.48% 61.79%  2048.81kB  7.48%  runtime.malg
 1542.01kB  5.63% 67.42%  1542.01kB  5.63%  bufio.NewWriterSize
 ...
Bingo. Nearly half of memory is allocated strictly for read and write buffers from our use of the bufio package. Thus, we can infer that optimizing our code to reduce buffering would be very beneficial. (The associated patch in Caddy does just that).
Visualizations
If we instead run the svg or web commands, we'll get a visualization of the profile:

This is a CPU profile but similar graphs are available for other profile types.
To learn how to read these graphs, read the pprof documentation.
Diffing profiles
After you make a code change, you can compare the before and after using a difference analysis ("diff"). Here's a diff of the heap:
go tool pprof -diff_base=before.prof after.prof
File: caddy
Type: inuse_space
Time: Aug 29, 2022 at 1:21am (MDT)
Entering interactive mode (type "help" for commands, "o" for options)
(pprof) top
Showing nodes accounting for -26.97MB, 49.32% of 54.68MB total
Dropped 10 nodes (cum <= 0.27MB)
Showing top 10 nodes out of 137
      flat  flat%   sum%        cum   cum%
  -27.04MB 49.45% 49.45%   -27.04MB 49.45%  bufio.NewWriterSize
      -2MB  3.66% 53.11%       -2MB  3.66%  runtime.allocm
    1.06MB  1.93% 51.18%     1.06MB  1.93%  github.com/yuin/goldmark/util.init
    1.03MB  1.89% 49.29%     1.03MB  1.89%  github.com/caddyserver/caddy/v2/modules/caddyhttp/reverseproxy.glob..func2
       1MB  1.84% 47.46%        1MB  1.84%  bufio.NewReaderSize
      -1MB  1.83% 49.29%       -1MB  1.83%  runtime.malg
       1MB  1.83% 47.46%        1MB  1.83%  github.com/caddyserver/caddy/v2/modules/caddyhttp/reverseproxy.cloneRequest
      -1MB  1.83% 49.29%       -1MB  1.83%  net/http.(*Server).newConn
   -0.55MB  1.00% 50.29%    -0.55MB  1.00%  html.populateMaps
    0.53MB  0.97% 49.32%     0.53MB  0.97%  github.com/alecthomas/chroma.TypeRemappingLexer
As you can see, we reduced memory allocations by about half!
Diffs can be visualized, too:
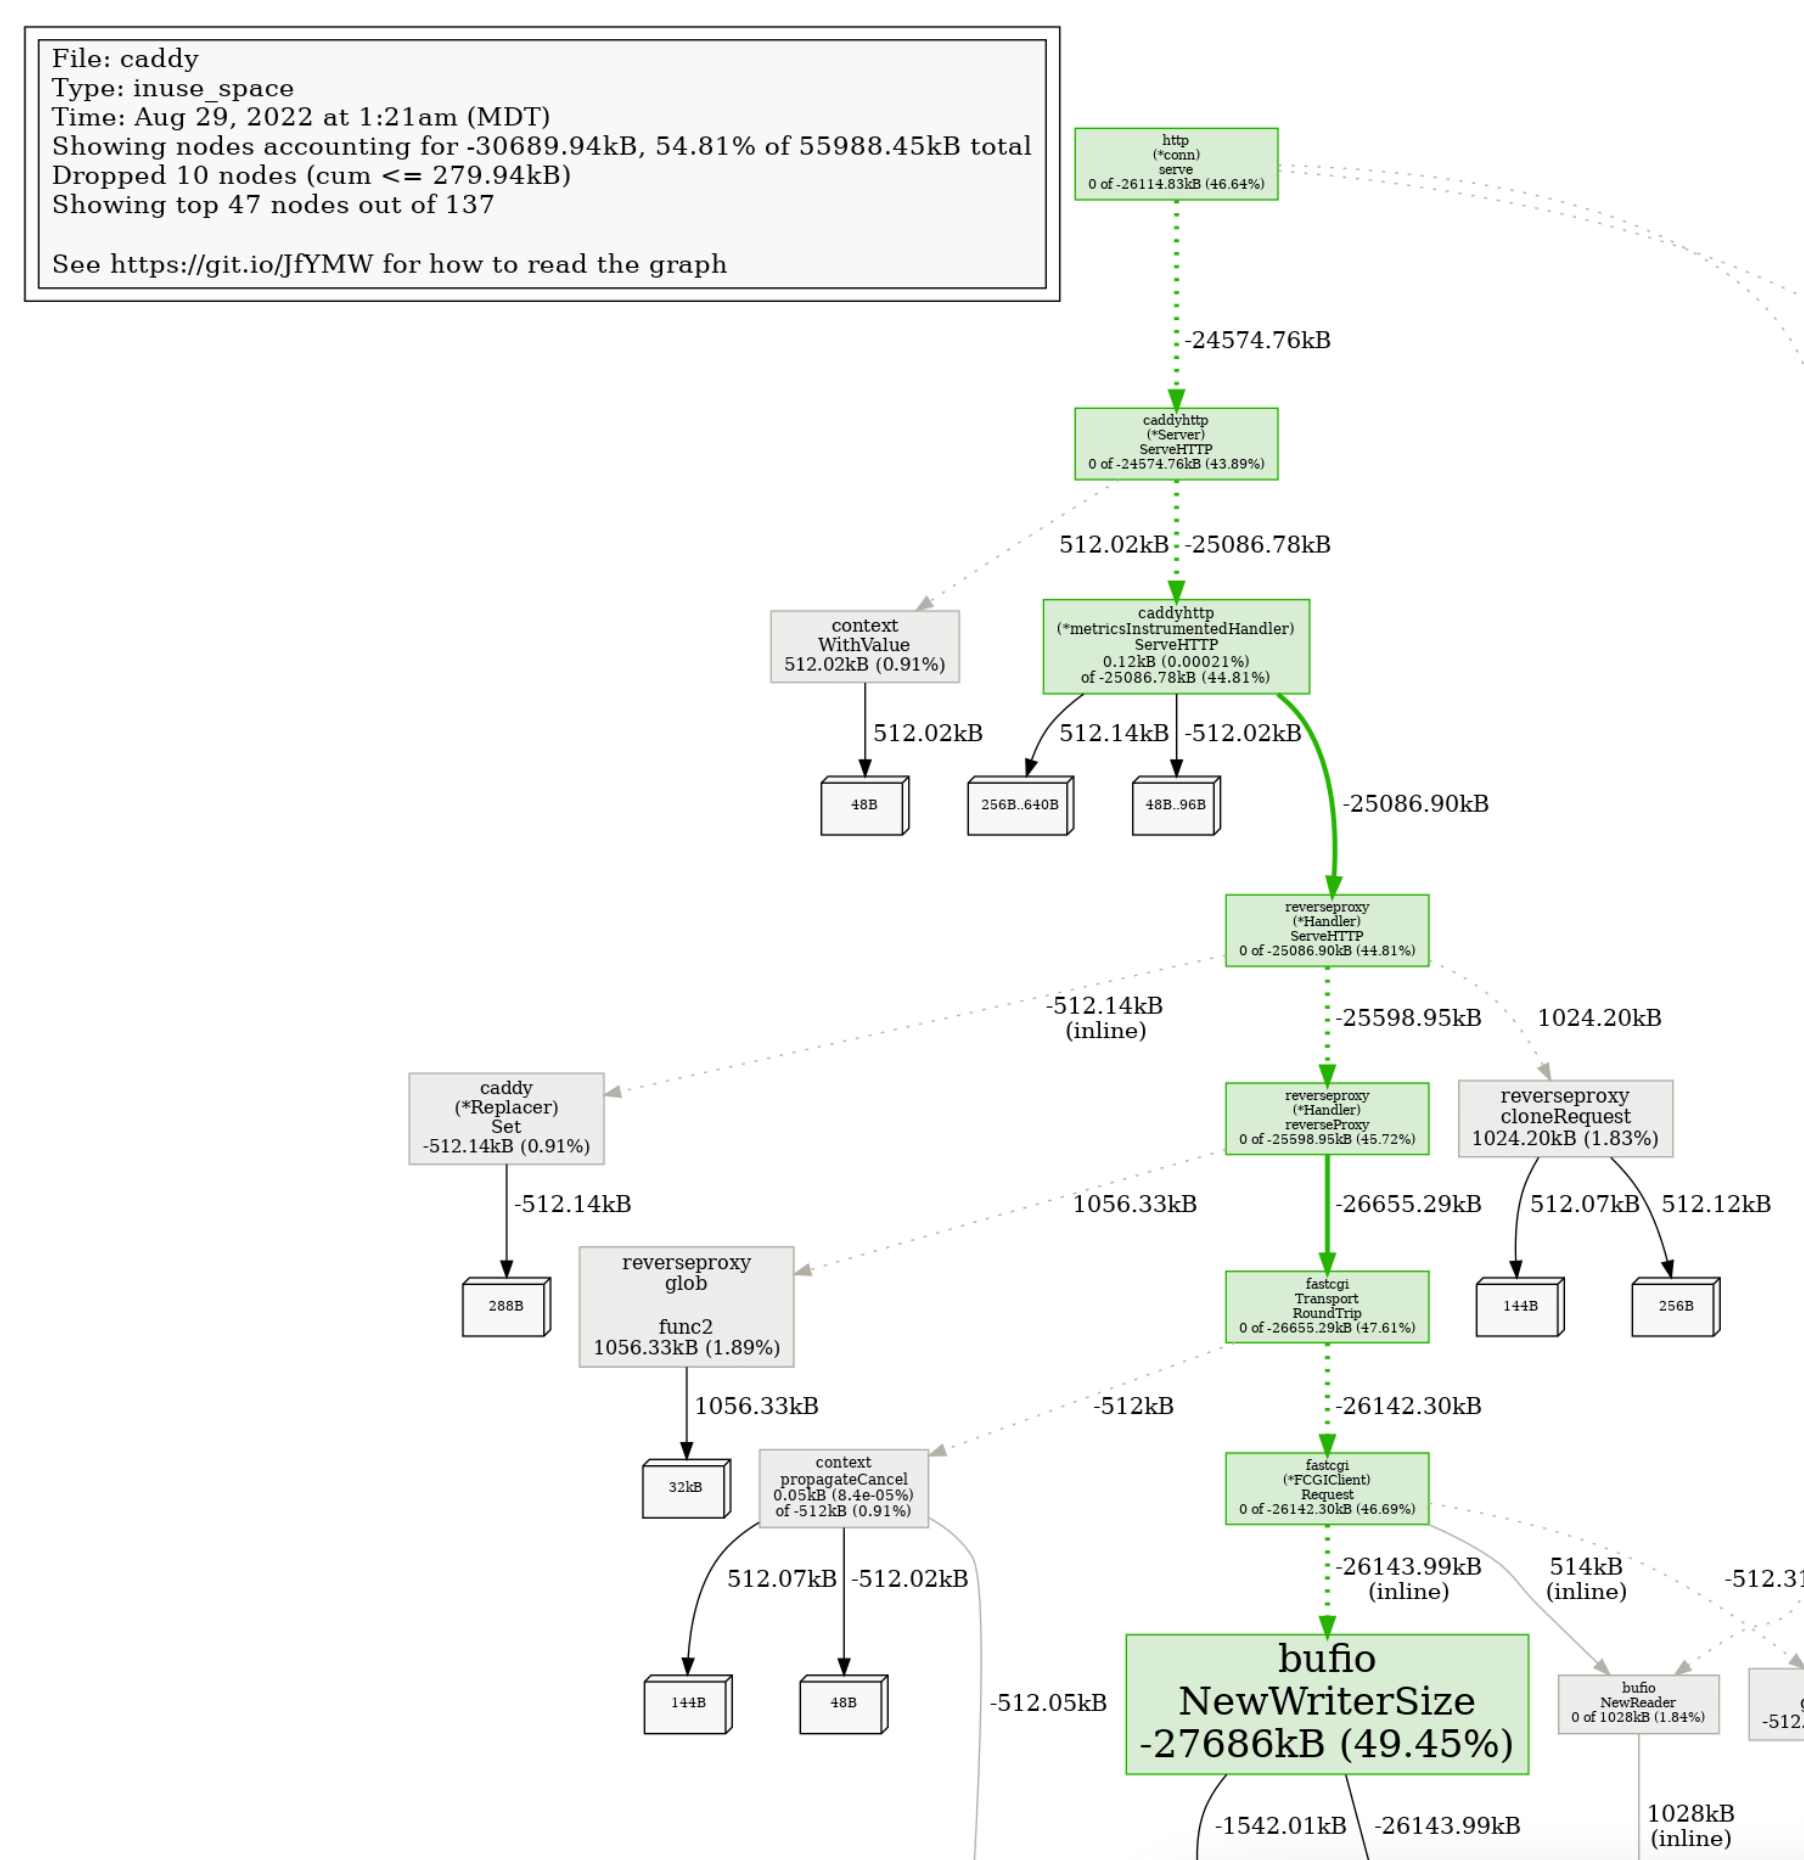
This makes it really obvious how the changes affected the performance of certain parts of the program.
Further reading
There's a lot to master with program profiling, and we've only scratched the surface.
To really put the "pro" in "profiling", consider these resources: